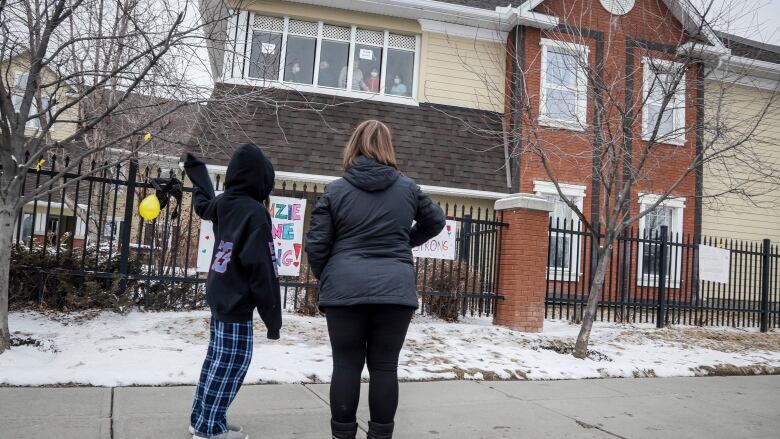
Google's tracking reports show how Albertans have shifted their movements to stay home
Visits to public locations began to drop as number of COVID-19 cases grew in the province
Google likely has more access to information about people's comings and goings than any other company or government on earth.
Now, it's giving the public a glimpse of that aggregated, anonymized data to demonstrate how mobility has changed in different regions due to the global coronavirus pandemic.
In Alberta, that data shows government recommendations and restrictions are keeping a large per cent of the population home but that a slightly higher per cent of Albertans are still venturing out to work or to the grocery store, and much fewer are visiting local parks, when compared with Canadiansas a whole.
Google Maps collects data to demonstrate on its website how busy public places are on a usual day which it provides so users can seewhen a dog park might be less crowded, or when a diner shouldwalk in to a restaurant without a reservation.
But thenew community mobility reports, released last week, showpercentage point increases or decreases in visits to categories of places like workplaces, grocery stores or residences Google said it hopes the data can inform public health officials' decisions.
Want to see a larger version of the chart below? Click here.
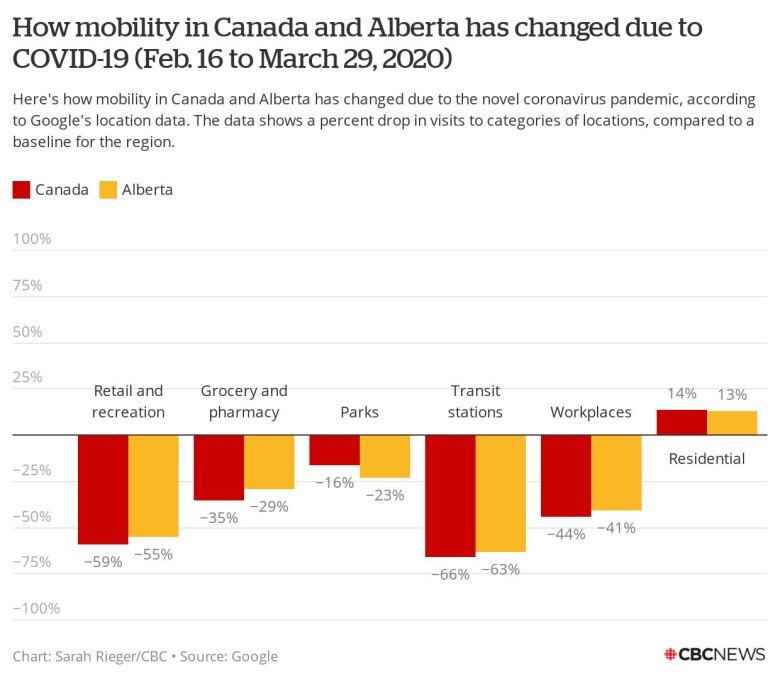
Movement betweenFeb. 16 and March 29 was compared to a baseline, the median value for the corresponding day of the week from Jan. 3 to Feb. 6.
In Alberta, here's how traffic dipped during that period:
- Visits to retail/recreation locations were down 55per cent.
- Visits to grocery stores and pharmacies were down 29per cent.
- Visits to parks were down 23per cent.
- Visits to transit stations were down 63per cent.
- Visits to workplaces were down 41per cent.
- Visits to residences were up 13per cent.
Those visits began to drop steeply in the period between March 8 and 21, when the number of cases in the province grew from five to 226.
During that period, schools and daycares were closed, bans on large gatherings announced, and the province declared a public health state of emergency.
It does not account for a large number of changes that have occurred since as the province has now surpassed1,000 cases of COVID-19,like the closures of non-essential businesses.
While those numbers might seem high, hardest-hit countries like Italy and Spain have seen visits to restaurants and theatres drop as much as 94 per cent. And in the U.S., numbers vary widely state by state.
Google has said its reports will be updated regularly, and the data will be from two to three days prior to each report's release.
While the data is anonymized, Google has been criticized in the past for lack of transparency and consent around how it collects location data.


_(720p).jpg)


 OFFICIAL HD MUSIC VIDEO.jpg)
.jpg)


