Better late than never? What to expect from COVID-19 modelling if Manitoba ever reveals it
Manitoba has not yet seen projections for possible scenarios of how coronavirus will impact province
Nearly six weeks after the province confirmed its first official cases of COVID-19, Manitobans still haven't seen modelling for how the pandemic could impact the population.
Public health officials say experts are working on models for how the disease caused by the novel coronavirus could affect the province long-term.
But so far, they have not made any of those numbers public,even as attention locally begins to turn to the question of how to reopen the economy safely.
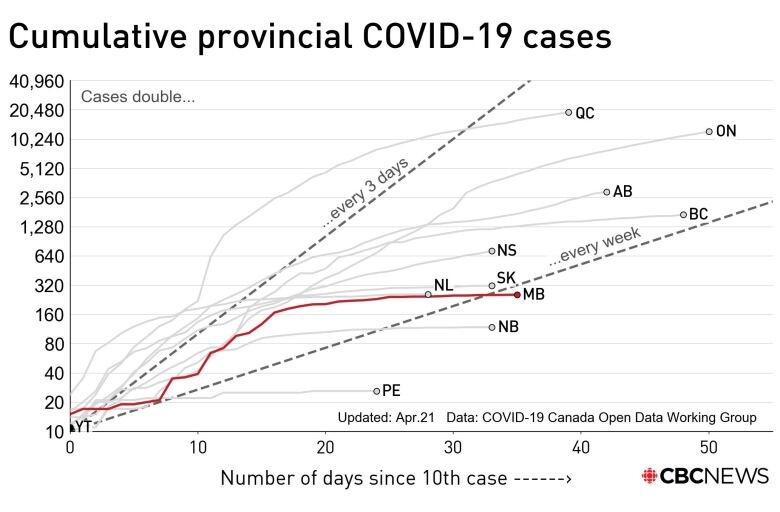
That puts Manitoba behind the 8-ball compared to other provinces including Saskatchewan, Alberta and Ontario and the federal government, which showed Canadians projections two weeks ago of different ways the pandemic could progress throughout the country.
Premier Brian Pallister has dismissed the idea of releasing a "conjectured guess" about the many possible trajectories of COVID-19 here.
On April 3, he said he didn't want to "scare the hell out of everybody" by releasing dire projections that might not come to pass or aren't even likely to.
In recent days, the premier has insisted the province is answering other questions about the pandemic, and refuted the idea that holding back projectionsis obfuscating anything the public needs to know.
"I would not want it stated,because it would be false to state it,that this is a lack of transparency," he said on Tuesday.
Dr. Brent Roussin, the province's chief public health officer, said the relatively latearrival of COVID-19 in Manitoba means the province has less hard data to work with, so modellers are facing delays.
"It's going to take a bit of time for us to have some good numbers. All the modelling depends on having valuable data to enter into it," Roussin said last Friday.
"A timeframe, I don't necessarily havebut we're going to work to try to get something out to Manitobans to show them a few different modelling scenarios."
WATCH | Manitoba premier says he doesn't want to release 'conjectured guess':

When the public does see the numbers, experts say it's crucial to understand the inherent uncertainty that comes with them.
"When thinking about models, they can seem like a bit of a black box to the public," said Lisa Lix, a Canada Research Chair in electronic health data quality and a biostatistics professor at the University of Manitoba.
"[It's] important to look at where those numbers are coming from."
So how do the models get made? Andwhen (or if) we see them, what will they mean for the province?
'Only as good as the data'
Before scientists make a projection, they need to know what it's for, Lix said. That means being clear about what they're trying to project whether that's the number of deaths, how many ventilators will be needed, or the possible result of public health interventions.
It also means knowing how confident they want to be in the results. In certain cases, models actually are intended to forecast what scientists think is likely tohappen usually in the very short-term, like the next week or twosays Daniel Coombs.
Theexpert in mathematical models of pandemic growth and control says inmany other cases like the best- and worst-case examples shared throughout the pandemicprojections aremeant to show a range of possibilities about could happenin potential scenarios.
"I think that there is an important difference between thinking about what could happen, and then really trying to say what will happen," said Coombs, amath professor at the University of British Columbia.
Even models that aremeant to have some value as forecasts are more like predicting the spread of a football game, Coombs saidnotthe exact score. And if you're looking at projections thatlayout various scenarios, you need to understandthey're just scenariosand not even necessarily likely ones and interpret them as such.
Once you know what you're trying to model, all modelling requires input meaning data. Data used in COVID-19 modelling includes numbers like how many confirmed cases there are, and individual disease dynamics, like how long it takes from the moment a person gets infected to when they become infectious.
Some of that data will come from the geographical area being modelled, but not all of it. Scientists can also reach for information from other jurisdictions around the country or around the world to construct various scenarios where needed, or use data from past disease studies to fill in blanks.
Latest local news:
- Security at Winnipeg's HSC stop 2 COVID-19 patients from leaving hospital against medical advice
- Wage reductions, more layoffs for City of Winnipeg workers part of worst-case COVID-19 scenarios
- Mint staff 'pumped' to produce sanitizer for Manitoba health-care system facing COVID-19
"[Models are] only as good as the data that is being fed into them, and the assumptions that they're based upon," said Nicholas King, an associate professor in the department of the social studies of medicine atMcGill University, and an associate member in the university's department of epidemiology and biostatistics.
"When we are working in an area where we don't have much information or our assumptions are very shaky, then the output of the models is a lot less reliable."
As more and betterdata becomes available, models will inevitably be updated,King said, and the public shouldn't interpret changes as meaning there were mistakes in the original projection.
Then, of course, there's the all-important R0, pronounced R-naught. This is the basic reproduction number the average number of new infections that will be caused by a single infected person while they're sick.
The problem is, it's only really clear when you're looking in the rear-view mirror.
"One of the important things about that number is we never really know what it is until everything's finished, and we have time to really go back through the data very finely," said Coombs. "It's difficult to estimate that on a real-time basis."
In Manitoba, modellershave used an R0 value of roughly 2.5 or 2.6, Roussin said Friday. On Tuesday, he said that he believes the province is now approaching an R-value of one.
Putting it all together
Once you've got all of those factors in place, the math behind the most basic type of disease modelling is simple, Coombs said.
"It's just a little bit beyond high school math," he said.
The simplestmodelsassume all sick people will interact with, on average, the same number ofpeople, and their illness will follow the same timelines, Coombs said.
That kind of model will produce a tidy epidemic curve that starts slowly, picks up speed and then grows exponentially before, eventually, hitting a peak and dropping off. Then, scientists can figure out how many people in that imaginary scenario got sick, and how long it all took.
"Those models are very, very simplistic, but they're super helpful as well, just in terms of broad strokes [in] understanding what happens," Coombs said.
From there,experts add layers of complexity to capture the different ways people behave and experience the disease, as well as the possible impacts of interventions like physical distancing.
At its most basic level, that can meanassuming a different infection rate,but it doesn't stop there. It also means layering in what we know about how the disease affects people based on age and health conditions, Coombs said, or how different population groups mix with each other.
"Social distancing and the kinds of things you see in the world at the moment, all of these effects that you build into the model have to have numbers associated with them," Coombs said.
"Estimating those numbers simultaneously [as] we're building the model is actually the challenging part of the game especially in real time, with a new disease, as we're seeing right now."
Uncertainty and transparency
Uncertainty is baked into modelling, King said. Projections can't get made without data and assumptions, and those are imperfect.
"[Uncertainty is] just a fact of modelling," he said. "The problem comes in when people don't understand that that's just a baseline limitation of these predictions."
The best models will be transparent and account for that uncertainty, said King, whether by offering upper and lower bounds to projections, or explicitly laying out different scenarios.
Modelsdon't actually make policy, he added policy-makers do, based on what they take from modelling, as well as their own values. As helpful as models can be for decision-makers, there's also the possibility they'll be misconstrued.
Releasing models publicly is a trade-off, King says, between transparency and the chance that people will read the numbers wrong.
"The more we can sort of verify what they're doing, the more sunlight is cast onwhat they're doing, and the more we can trust in those resulting decisions," he said.
"Even if it's scary, even if you're worried that you're going to create panic, it's better to be as transparent as possible."
When that happens, it's incumbent on scientists, policy-makers and media to help ensure the public doesn't see a crystal ball where there isn't one.
"The biggest problem here, I think, is false certainty whether it is proclaimed by a modeller or a pundit or a politician," King said.
"Really, no one knows what's going to happen [during] the COVID-19 pandemic. The best that we can do is try as hard as we can to predict the possible range of outcomes."


_(720p).jpg)


 OFFICIAL HD MUSIC VIDEO.jpg)
.jpg)


