Montreal home valuations up 6%, lowest in a decade
RosemontLa Petite-Patrie, VilleraySaint-MichelParc-Extension see highest increase among boroughs
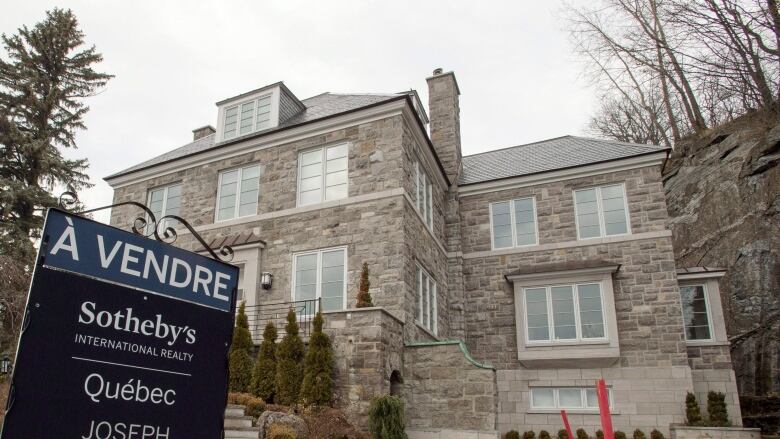
Property assessments in Montreal are up 5.9 per cent, the lowest increase in a decade.
The head of the city's executive committee said the new numbers reflect a levelling off in the growth ofproperty values.
"Such stability helps prevent the kind of real estate bubble we've seen in Vancouver and Torontoand helps keep housing affordable across the island, " Pierre Desrocherssaid Wednesday.
Theproperty assessments will beused to help determine property taxes for the next three years, from 2017 to 2019.
Within the City of Montreal,RosemontLaPetite-Patrie,VilleraySaint-MichelParc-Extension and the Southwest borough had the highest increases.
Among municipalities,Westmountand Town ofMountRoyal saw the largest jump.
Previous rolls had seen values increase by more than 20 per cent.
- More and more Montrealers challenging property assessments
- See below for a breakdown of the increases
'Chill' onhousing market?
The Greater MontrealReal Estate Board had earlier predicted a five per cent increasefor single-family homes and duplexes.
Paul Cardinal, director of market analysisat the Quebec Federation of Real Estate Boards,attributed the low increase inpart to achange in mortgage rules.
"In 2013, the maximum amortization period dropped from 30 years to 25 years. That cast a chill on the Quebec housing market," he said.
"We continued to see a slowdown in sales in 2014 ... But in 2015until today, the market is growing again."
Executive committee head Pierre Desrochers says new valuations suggest Montreal is avoiding overheated market pic.twitter.com/rf5IVGSpVY
—@SteverukavinaAverage property increases, by municipality
- Westmount- 7.2%
- Town of MountRoyal - 6.6%
- Montreal - 6.2%
- Pointe-Claire- 5.8%
- Beaconsfield - 5.5%
- Montreal-East - 5%
- Dollard - 4.2%
- Montreal West - 2.9%
- Kirkland - 2.5%
- Cte-Saint-Luc- 1.9%
- Senneville - 1.8%
- Sainte-Anne-de-Bellevue - 1.1%
- Baie-D'Urf- 1.11%
- Hampstead - 0,1%
- Dorval Island - minus 4.3%
Average property increases, by borough
- RosemontLaPetite-Patrie- 9.3%
- VilleraySaint-MichelParc-Extension - 8.3%
- Southwest - 7.8%
- Cte-des-NeigesNotre-Dame-de-Grce - 7.7%
- PlateauMont-Royal - 7.2%
- Outremont - 6.3%
- Montreal - 6.2%
- Ville-Marie - 6.1%
- MercierHochelaga-Maisonneuve- 6.1%
- Lachine - 5.8%
- Saint-Laurent - 5.4%
- Ahuntsic-Cartierville - 5.1%
- Rivire-des-PrairiesPointe-aux-Trembles - 5%
- LaSalle - 4.8%
- Montreal North - 4.7%
- Pierrefonds-Roxboro - 4.6%
- Verdun - 4.3%
- le-BizardSainte-Genevive - 3.8%
- Anjou - 3.7%
- Saint-Leonard - 3%
with files from Steve Rukavina


_(720p).jpg)


 OFFICIAL HD MUSIC VIDEO.jpg)
.jpg)


