Mapping Yukon's vulnerability to climate change
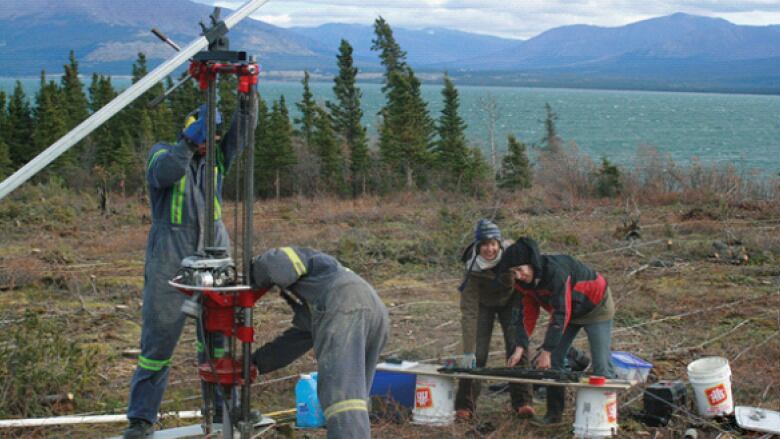
Researchers studied permafrost samples to determine best, and worst, areas for development
A new setof Yukon community maps offers a colourful look at how climatechange could threaten infrastructure, and affect future development in the territory.
The maps are the product of a six-year research project spearheaded by Yukon College's NorthernClimate ExChange. The goal was to identify areas considered safe to develop, and thosewhere natural hazards might pose a threat.
"These are hazards related to permafrost thaw, flooding, ground instability," said Bronwyn Benkert, manager of the Northern Climate ExChange.

"The idea is that communities, consultants,[or the] Yukon governmentcan use these maps to think about areas that are suitable for future development, or places where they're having problems and may need to think about remediation or ways of strengthening infrastructure."
The researchers have developed maps of seven Yukon communities that are built on permafrost and may bemost vulnerable: Mayo, Dawson City, Faro, Ross River, Pelly Crossing, Burwash Landing/Destruction Bay, and Old Crow.
Green is good, red is bad
The maps use the colours of a stoplight to indicate areas of greater or lesser risk. Red areas are considered most risky for new infrastructure, while green areas are considered relatively stable and safe. Yellow areas are moderately vulnerable.
Berkert says the goal was to translate years of complex field research and modelling into easy-to-understand maps.
"The thing that's been really useful for the communities is that the output is very simple," she said. "It's been really fun to do this project because we've seen it being taken up by communities as we've been doing it."

In Burwash Landing, researchers found that areas where "fire-smarting" had been done (thinning aforest to reduce risk of wildfire) had stable permafrost, whereas areas where trees had been completely cleared were less stable.
"It tells us about the level of disturbance that the ground, that permafrost can sustain before it begins to thaw," Berkert said.

The maps are also helping the community of Old Crow plan for the future, she said. The researchers found that areas in the community that had beendeveloped in the past, but were now open,tended to be morestable because they had already seen permafrost thaw. The best decision, therefore, mightbe to target new development to those spaces.
Berkertcalls the maps a "first step" in community planning.
"Sometimes we say, 'here's a green area that's on the map that's really safe for construction,' but actually a community wants to build in a yellow area because it's close to a road, or a good view. They need to understand the economic implications of that in order to plan well.
"We're working with engineers and economists as part of our team to think about resilient designs of our buildings."
With files from Sandi Coleman


_(720p).jpg)


 OFFICIAL HD MUSIC VIDEO.jpg)
.jpg)


