How hot is your 'hood? New map takes Ottawa's temperature
Snapshot from July 2019 reveals vast differences in surface temps across the city
In the mid-summer of2019, Ottawa was melting under a withering heat wave.
On July 18, Environment Canada issued a heat warning and Ottawa Public Health advised residents to stay hydrated and check on vulnerable neighbours.
According to historical weather data, the temperature that Thursday neared 28C and it felt like 31 with the humidity, but certain areas of the citywere considerably hotter as much as 10 degrees Celsius hotter in some places.
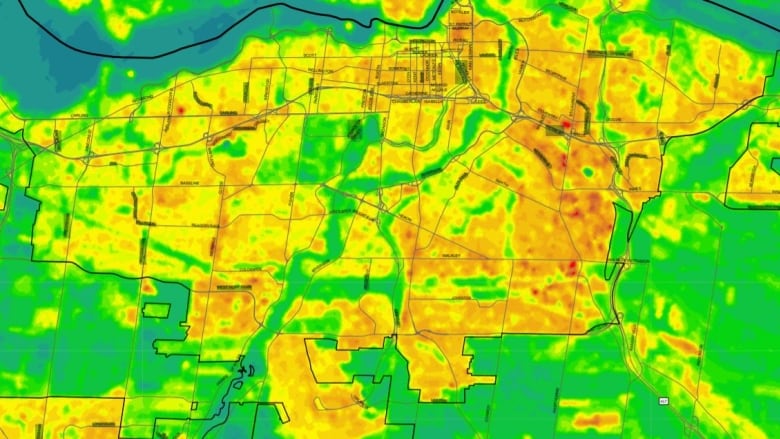
A map produced by the city and public healthshows precisely where those hot spots were and where they remain today.
Using satellite imagery, thecolour-coded mapshows a wide range in surface temperatures recorded that day, from 15 C along portions of the Ottawa River to between 36 and 38 C in certain small pockets of the city where both water and vegetation are in short supply.
Those pockets appear on the map as red dots surrounded by brown, yellow and other hues representing slightly cooler temperatures. The coolest areas appear on the map in shades of green and blue.
Lots of asphalt, few trees
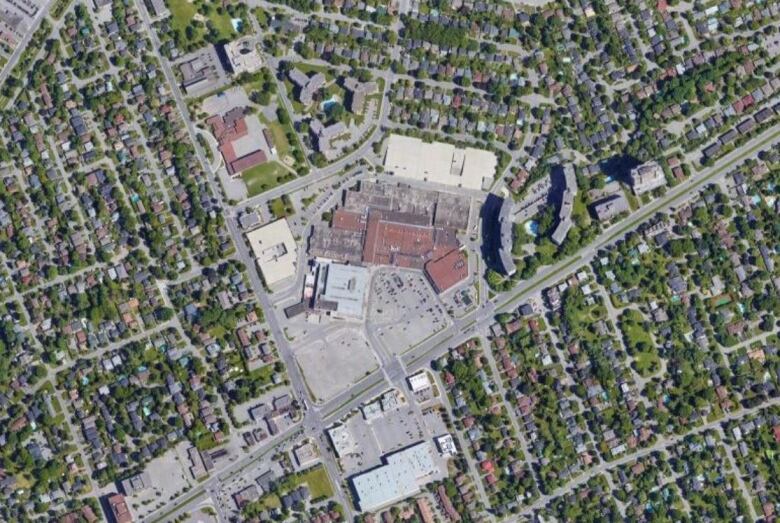
One of the red zones is Carlingwood Shopping Centrewhere the former Sears store was demolishedjust three months before the satellite image was taken, and its surrounding parking lot.
Even on a clear October day, it's easy to see why: the mall's expansive roof is flat and dark in colour, it's surrounded by hectares of asphalt, and unlike nearby residential neighbourhoods, there's virtually no vegetation to help absorb the heat or shield shoppers from the sun's glare. This is the urban heat island effect in action.
"The surface temperature range is pretty astonishing," said Robb Barnes, executive director of Ecology Ottawa, who got his first good look at the map earlier this month. "We know that the urban heat island effect is pronounced, but I didn't know it would be that extreme."
Only a handful of other areas reached the same surface temperature as Carlingwood on July 18, 2019, all in the city's east end: St. Laurent Shopping Centre, OC Transpo headquarters on St. Laurent Boulevard, an industrial park near the Canada Science and Technology Museum, and pockets near the Giant Tiger on Walkley Road.
They all share common characteristics with Carlingwood: massive buildings with flat roofs, vast surface parking lots and little to no greenery.

Maps are 'powerful tools'
These heat maps can tell another story, too, Barnes said: They can lay bare the problem of housing inequality by demonstrating wealthier neighbourhoods tend to be more verdant than poorer ones, and therefore more comfortable for the people living there.
"Maps are such powerful tools for conveying that information," Barnes said. "There's so much you can do with that kind of map data that would really help paint a picture of what's needed in Ottawa, and what are the opportunities for improving our city."
One obvious solution is planting more trees to breathe some life into those barren spaces.
The city's draft official plan sets a long-termurban tree canopy target of 40 per cent, an ambitious goal considering only about one-quarter of Ottawa's urban landscape is currently shaded by trees. (A separate tree canopy assessment of the National Capital Region in the fall of 2019 estimated Ottawa's coverage at 31 per cent.)

Looking at maps like these reveals where those trees are needed most, according toJennifer Court, executive director of the Green Infrastructure Ontario Coalition.
"For people who live in urban areas and experience the impacts of urban heat, it helps to put a visual representation to something that they have lived experience with," she said.
Court also mentionedgreen roofs and permeable parking lotsas other potential solutions to cool down the hot spots revealed by the map.
She said the maps are also useful tools to helpcities shape social policies and make decisions such as where to open cooling centres when temperatures rise to dangerous levels.
"Seeing a map like this and understanding what parts of the city nearby might offer some reliefcan be a real help and can be a real lifesaver," she said.
According to the city, average temperatures in Ottawa are expected to rise by 3.2 degrees Celsius over the next three decades, and the average number of days above 30 C will quadruple to 43 a year. Vulnerable residents including the very young and old, pregnant women, people with existing health conditions, people who work outside and people experiencing homelessness are most at risk as temperatures rise.
"Heat island maps can be used to guide policies and planning of the built environment," the city said on its website.
Barnes said Ecology Ottawa and other groups plan to press the city to make that a priority during upcoming discussions over Ottawa's official plan.


_(720p).jpg)


 OFFICIAL HD MUSIC VIDEO.jpg)
.jpg)


