Calgary's cycle track numbers show ridership has grown, but unevenly so far
Numbers are way up on 5th Street and most of 12th Avenue, but have barely changed on 8th Avenue
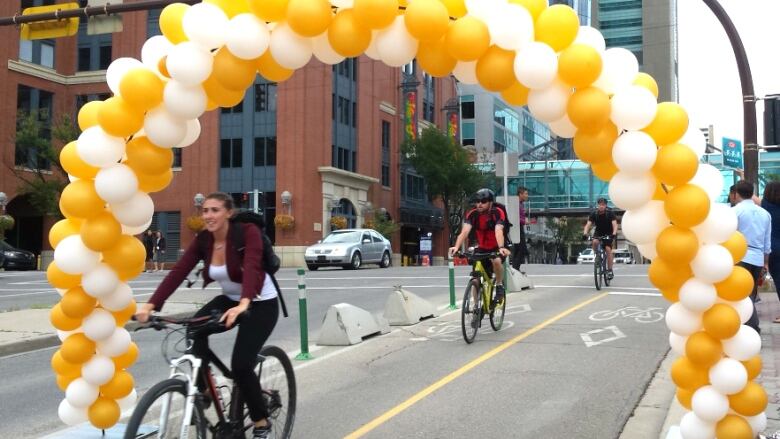
Calgary cycling enthusiasts celebrated a milestone Wednesday: one million trips on the city's downtown cycle tracks.
That's the approximate total recorded so far by three automated counters at central pointsalong the separated cycle lanes on12th Avenue South, Eighth Avenue South, and5th Street S.W.
There are actually many more counters than that, however.
- Calgary's cycle track network turns a year old
- Cycle tracks needmore connections to pathways, cyclistssay
Inductive loops that detect when metal passes overtop of them are embedded beneath the road's surfaceat points allacross the cycle-track network, and thedata thosedevices collect will play a key role in determining the network's fate.
City council is set to decide in December whether to keep, modify or remove the lanes, and the ridership numbers will factor heavily into their deliberations.
So how do the numbers look, so far?
Nearly two years ago, the city set targets to double, triple or quadruple pre-cycle-track ridership along different sections of the network, compared to baseline measurements taken in the fall of 2014.
City officials declined to speak about the targets this week, saying it's too early, sincethecomparison numbers are tobe based on ridership levelsin September 2016.
But the automated bike counter data ispublished onlinedaily and offers an earlyglimpse of how things are going.
For comparison purposes, we looked at daily counts over the past month (July 17 to Aug. 17) and took the weekday average.
It should be noted that the baseline "daily" counts in 2014 were recorded manually over a period of 16 hours, while theautomated counters record for a full 24 hours each day. The number of riders in the off-peak (overnight) eight hours is typically very low, however.
Here is an interactive map depicting the various counter locations. The locations in black are ahead of city ridershiptargets. Those in red are behind the target levels.
Click on each location for specific numbers:
As you can see, the numbers are up way up along two main downtown stretches.
Ridership has tripled atthe three count locations along Fifth Street S.W.and more than quadrupledon the western portion of12th Avenue S.W.
Further east, however, the numbers aren't as strong.
Ridership has only doubled at the 12th Avenue counter near Third Street S.E., whichis behind the city'starget of a threefold increase.
The counter at Ninth Avenue near Fourth Street S.E., meanwhile, has actually seen fewer cyclists than before the cycle track went in.
The Eighth Avenue cycle track is also behind target levels. The goal is to double ridership on that stretch but amere three per cent increasewas recorded by the counter near Eighth Street S.W. and a25 per cent increase by the counter near Third Street S.W.
Cycling outside the centre city
Of course, these automated counters only offer a limitedsnapshot of cycling in Calgary, as a whole.
The downtown cycle tracks are relatively small in the scale of Calgary's transportation system, occupying a mere seven of roughly 16,000 lane-kilometres of paved roadway.
Looking a bit further out from the city's core, however, ridership numbers also seem to be on the rise.
Every two or three years, the annual civic census includes questions about commuting habits, and there has been a steady rise in the number of people saying they ride a bike to work.
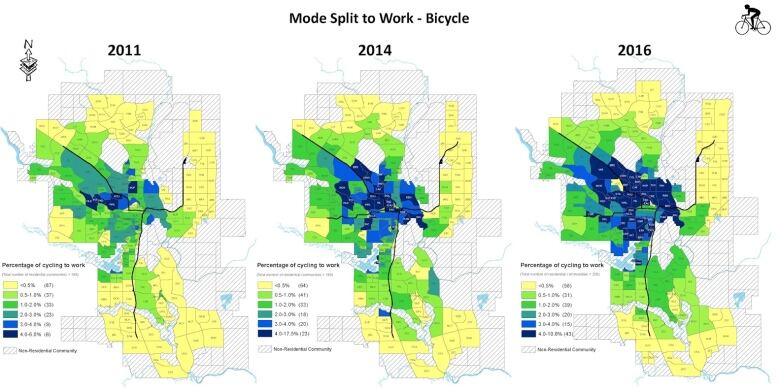
In 2011,there werejustsix communities where at leastfour per cent of respondents reported commuting by bike.
In 2016, that had risen to 43 communities.
One other measure, known as the Central Business District Cordon Count, also shows a sudden spike in cycling this year.
This is a manual count the city has done for decades. It employs data collectors who literally sit for hours each day at dozens of entry points around the downtown core over a period of three weeks in May and, using specialized control pads, record every single person they see coming and going by bus, in cars, by bike and on foot.
From 2012 to 2015, the proportion of cyclists stayed virtually unchanged, hovering between1.6 and 1.8per cent overthe 16-hour counts.In 2016, it suddenly jumped to 2.4 per cent.
Four other ways cycle tracks will be evaluated
Cyclist volumes are just one of five primary metrics city staff will focus on when they prepare anevaluation of the Centre City Cycle Track Network to presentto city council later this year.
The others are:
- Satisfaction: Based on phone surveys and interviews, citystaff will evaluate whether Calgarians are satisfied with the experience ofwalking, biking and driving along the cycle track routes.The targets vary slightly from route to route, but the city is generally aimingfor increases of10 to 30 percentage points in cyclistand pedestrian satisfaction, and no reduction in driver satisfaction.
- Safety:The city has set agoal of a 10-per-cent reduction in the collision rate along cycletrack routes. This will be based on data from police.
- Driving time:Based onGPS data and physical stopwatch trials, city staff will measure how long it takes motorists to travel along the cycle track routes during rush hour. The goal is tokeep any increase in travel time below 20 per cent.
- Unlawful cycling:Before the cycle tracks were put in, the city measured how many cyclists were illegally riding on the sidewalk or against traffic on the road.Based on direct observation and recordings from video cameras, the goal is to reduce both to nearly zero on most routes. (One exception is along the Ninth Avenue S.E. cycle track, where the goal is to cut sidewalk riding tobelow 10 per cent of riders, down from the notably highbaselinemeasure of 64 per cent.)
In addition to these main metrics,the city will also look at "secondary performance measures"including the age and gender of cyclists.
Using in-person observations and video recordings of cycle track traffic, the goal is to have female ridership grow to account for at least 25 per cent of people using the network, andto increase the number of cyclists under the age 14 and over the age of 65, compared to baselines fromthe fall of2014.
One other secondary measure will be the economic impact on businesses near the cycle tracks. The city plans to look at the number customers local stores see and the amount of money people spend at them, based on surveys of merchants and patrons.
Of course, none of these things will, on their own, make or break the cycle tracks.
Ultimately, it will be up to the 15 members of city council who voted by an 8-7 margin to create the cycle tracks in the first placewhether the network stays or goes.


_(720p).jpg)


 OFFICIAL HD MUSIC VIDEO.jpg)
.jpg)


