Data enthusiast's map could predict Calgary car crashes
Engineer visualises city's crash data map so public can see where traffic problems happen
Saadiq Mohiuddin came across a spreadsheet filled to the brim, column by column, with real-time collision data. He thought it might be useful and got to work.
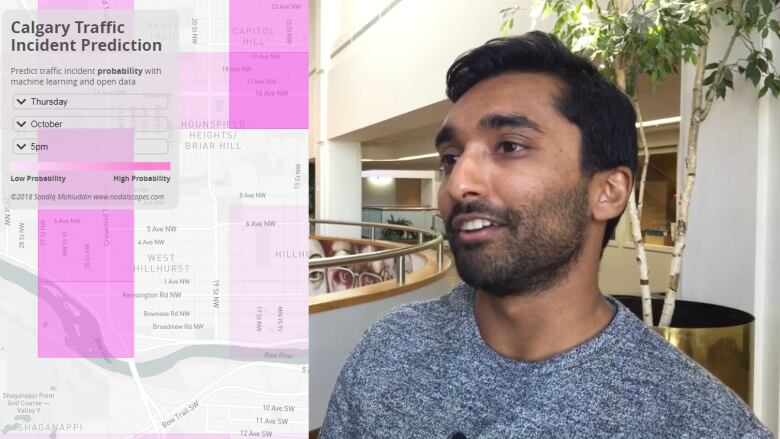
What he created, in the end, was an interactive map decodingreams of numbers for average eyes to see where, according to Calgary stats, cars are more likely to crash.
Mohiuddin, who is an engineer and data enthusiast, says that in his search for data that's detailed enough for this kind of treatment across Canada he came up short. He found many municipalities, and provincial bodies, are only releasing summaries of information.
The open data trend has swept across Canada, and Calgary itself has an open data portal online. The city advocates creative thinkers to tap into the wealth of information with an annual hackathon event.
Mohiuddin says he took the raw numbers straight from that open data portal, extracted what he found most interesting and visualized it. That means, he grabbed information on what day of the week crashes were happening, in which parts of Calgary, how often, during what times and how that changed over the months.
What he got was a map that users can toggle to specify the day of the week, month and time to see a snapshot of the city's problem spots.
"It was kind of what you'd expect for different times a day," he said. "For example, in October, Novemberand December, you'd see collisions in a certain location. And for the afternoon rush hour, you'd see Glenmore or Crowchild, certain major roads, you seehigh activity of collisions in those areas."
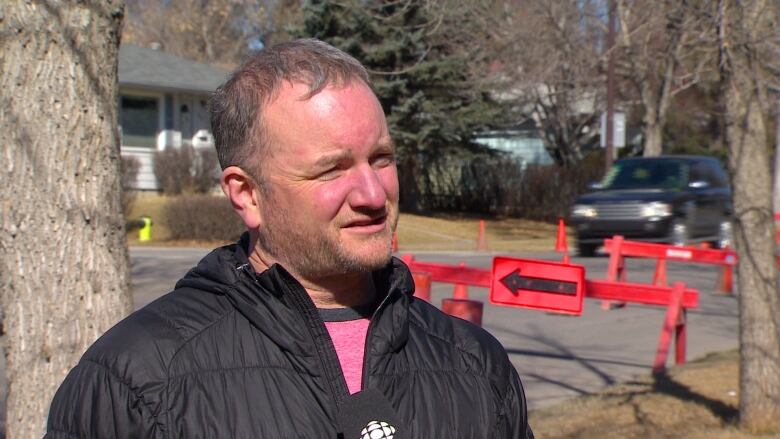
Greg Hart, the executive director for Safer Calgary and an advocate for better street design, says cities don't have enough manpower to find innovative ways to use all the data they collect. And opening up data to the public can be a win for municipalities because it means more eyes and creative minds will look at the numbers.
"If you make it available to the public as the open data, then there are people out in the public, like the person who put together this original little story, that can do work on this stuff," Hart said. "They can get a bunch of their friends together and they can geek out on it."
Data map not perfect
Hart sees even more possibilities for open data mapping and studying when city data is melded with information recorded in cars, that could track behaviours before and after a crash and give researchers a better picture of what happened.
But in terms of this example of what data can do, that's pretty advanced, he said.
Mohiuddin concedes that the data isn't perfect. The city's release only included numbers between December 2016 and September 2018, with only 10,000 traffic incidents so more numbers would make the prediction model more precise.
"It's a start," he said. "I created a model that'susable. But with more data, we can create more powerful models, more accurate models, which can really be used for your average person to understand, but also at a higher level for government or municipality to optimize their ways of doing things."
- MORE ALBERTA NEWS |How Alberta built enough roads to reach the moon
- MORE ALBERTA NEWS |Why slamming on the brakes won't stop a new kind of speed camera that could end up on Alberta roads
- Read more articles byCBC Calgary, like us onFacebookfor updates and subscribe to ourCBC Calgary newsletterfor the day's news at a glance.


_(720p).jpg)


 OFFICIAL HD MUSIC VIDEO.jpg)
.jpg)


