New map lets Canadians see just how hot hometowns could get this century
Climate Atlas of Canada gives users interactive peek at global warming in their own backyards

An ambitious new mapping projectgives Canadians a chance to peer into the near future and visualize just how hot a warming climate could make their own backyards over the next 80 years.
"The impacts are startling," said Ian Mauro, a filmmaker and co-director of the University of Winnipeg's Prairie Climate Centre, which launched its Climate Atlas of Canada on Wednesday. "Part of this map is data, but part of it is storytelling."
The atlas includes documentaries ofhow Canadians are trying to adjust to present-day effects of global warming and a robust interactive map that lets users zoom down on any one of2,000 towns or citiesacross the country to see how climate change is likely to change local landscapes between now and the end of the century.
The 250-layermapis based on data from 12 global climate models. Users are shown a baseline period of warming trends by region that spansfrom 1950to 2005 and can toggle betweentwo future projection periods, 2021 to 2050 and 2051 to 2080.
"For most of my life, I've been combining science and communications to engage Canadians regarding the importance of the environment," David Suzuki, scientist and host ofCBC'sThe Nature of Thingssaid in a statement.
"Along this journey, I've collaborated with Dr. Mauro on his climate change filmmaking, and believe the Climate Atlas of Canada is a game changer.I hope it helps all Canadians realize the need for immediate and widespread climate action."
With the click of a button, users can hone in on any region and explore the area's future climate. For instance, they can learn how many additional hot days (defined as any dayabove 30 C) a community is likely to experience in the near future if greenhouse gas emissions continue to rise at current rates.
In this "business as usual" scenario, in roughly 45 years, Toronto would see an average of 53days a year whenthe temperature hits 30 C or warmer, and Winnipeg would see an average of 47 days above 30 C. That's compared to an average of 12 days above 30 C for Toronto from 1976-2005, and 11 days for Winnipeg during the same period.
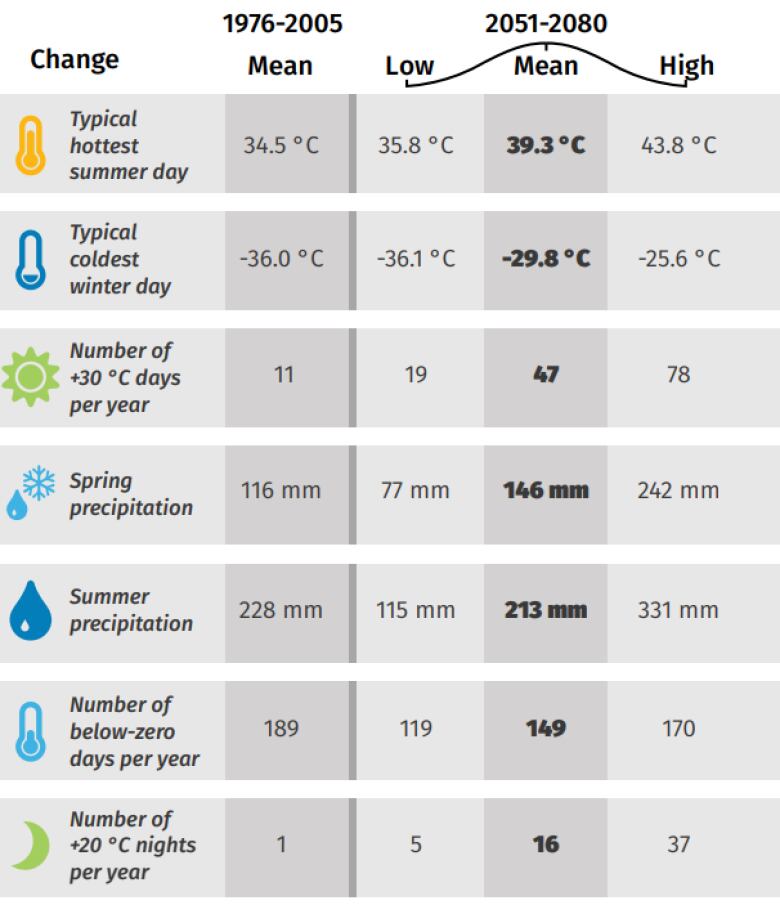
Global warming also means fewer cold days, including in the North, where thinning sea ice and melting permafrost are already threatening Arctic ecosystems and traditional ways of life.
Theatlassuggests Yellowknife could see an annual average of 37 fewer days below 30 C within the nextfew decades.
Each major Canadian city on the map has its own reportthat reveals projected warming trends, possible impacts and suggestions for ways to help reduce greenhouse gasemissions.
Seeing is believing
The atlas is free, bilingual and the first of its kind, Mauro said.
The point is to help Canadians better understand how climate change is likely to touch their lives as temperatures continue to rise in the coming decades, and to get them thinking of ways to mitigate those risks,Mauro said.
"When we start to look at the implications of climate change across the country moving forward over the next century, it is absolutely clear to the scientific community that the change is coming, but the trick is how do we translate that kind of data to something that is meaningful to Canadians?" Mauro said.
Scientists want Canadians to know what's in store without causing them to "shut down or fall into a state of paralysis," he said.
"This change could be considered scary, but there's also really an opportunity to dig deep into our collective experience as Canadians and figure out how to drive solutions into our own local landscapes."
Better communication needed
Apart from small-scale solar panel projects and eco-friendlylifestyle changes,carbon pricing and better communication of climate science havebeen identified as key strategiesthat could help reduce emissions and lessensome of the nastier projected changes.
In a report out Wednesday, Canada's Ecofiscal Commission says carbon pricing in parts of the countryhasshown promising signs of reducing greenhouse gas emissions while also supporting strong economies, said commission executive director DaleBeugin.
In B.C., where a carbon pricing scheme has been in place for almost a decade, a tax on carbon has proven its worth, Beugin said. Data indicates without the tax, B.C. would have seen five to 15 per cent higher greenhouse gas emissions since it was brought in; fuel efficiency of the averagevehiclein the province would be four per cent worse than it is today; and demand for gasoline would be 17 per cent higher on a per capita basis, Beugin said.
But the Ecofiscal report came bundled with the results from an Abacus research poll thatsuggests a significant number of Canadians don't believe carbon taxes are effectiveor that humans causeclimate change. Seventy per cent cited human activity as the main factor in climate change, while the remaining 30 per cent chalked it up to "natural patterns in the Earth's environment."
Just 56 per cent of Manitoba and Saskatchewan respondents said they think governments should focus more on combating climate change.
"I think that we would say so far that public policy conversation isn't as rooted in the facts and evidence as we nerdy economists would like it to be," Beugin said.
"The takeaway is there is room for a better conversation across Canada and in lots of the jurisdictions, there's recognition that Canadians want to reduce GHG emissions, but maybe they aren't as aware of the options, they don't fully have their head around all the options in a complete way."
Mauro also said there needs to be a different kind of climate change conversation in Canada, one that makes sometimes-convolutedclimate science more accessible, which is what the atlas tries to do.
"Climate change is real and it's human-caused, full stop. The quicker we can grasp this as a society, the better off we will be in terms of environmental sustainability and, ultimately, economically in the long term," Mauro said.
"We often talk about climate change as this thing that's sort ofin the far future that isn't going to affect me because it's happening somewhere else, and the climate atlas definitely shows people that this is something that will happen in our own backyard."
The federal government has contributed $1 million to the Prairie Climate Centre and its continued development of the atlas. The Manitoba government, Great-West Life and the Social Sciences and Humanities Research Council also helped fund the effort.


_(720p).jpg)


 OFFICIAL HD MUSIC VIDEO.jpg)
.jpg)


