Teacher numbers for P.E.I. schools released
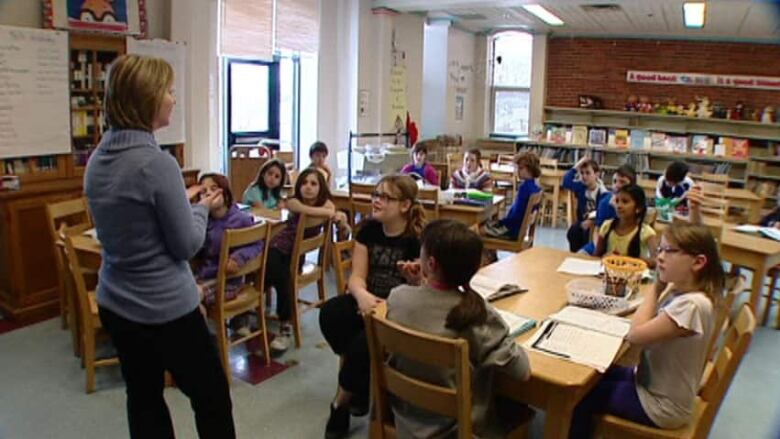
The P.E.I. Public Schools Branch has released how many teachers each school in the province will have next year.
The information was released early Wednesday afternoon. CBC News has organizedthe following table to compare teaching positions in the Island's four largest communities Charlottetown, Summerside, Stratford and Cornwall with the rest of the province.
| Charlottetown, Summerside, Stratford and Cornwall | ||||
| 2016-17 | 2017-18 | Change | % Change | |
| Athena Consolidated | 27.6 | 26.92 | -0.68 | -2.46% |
| Birchwood Intermediate School | 18.37 | 31.93 | 13.56 | 73.82% |
| Charlottetown Rural High School | 56.99 | 57.84 | 0.85 | 1.49% |
| Colonel Gray High School | 54.84 | 54.66 | -0.18 | -0.33% |
| East Wiltshire Intermediate | 39 | 40.59 | 1.59 | 4.08% |
| Eliot River Elementary | 28.28 | 30.22 | 1.94 | 6.86% |
| Elm Street Elementary | 32.6 | 31.8 | -0.8 | -2.45% |
| Glen Stewart Primary | 47.66 | 48.92 | 1.26 | 2.64% |
| Greenfield Elementary | 26.22 | 25.62 | -0.6 | -2.29% |
| L. M. Montgomery | 31 | 30.08 | -0.92 | -2.97% |
| Parkdale Elementary | 11.37 | 11.17 | -0.2 | -1.76% |
| Parkside Elementary | 26.93 | 26.88 | -0.05 | -0.19% |
| Prince Street Elementary | 23.31 | 21.36 | -1.95 | -8.37% |
| Queen Charlotte Intermediate | 34.47 | 36.81 | 2.34 | 6.79% |
| Sherwood Elementary | 37.82 | 40.12 | 2.3 | 6.08% |
| Spring Park Elementary | 39.86 | 42.57 | 2.71 | 6.80% |
| St. Jean Elementary | 11.6 | 10.73 | -0.87 | -7.50% |
| Stonepark Intermediate | 55.9 | 44.22 | -11.68 | -20.89% |
| Stratford Elementary | 28.65 | 32.92 | 4.27 | 14.90% |
| Summerside Intermediate | 31.5 | 33.11 | 1.61 | 5.11% |
| Three Oaks Senior High School | 52.33 | 50.46 | -1.87 | -3.57% |
| West Kent Elementary | 14.1 | 25.1 | 11 | 78.01% |
| West Royaly Elementary | 35.6 | 33.17 | -2.43 | -6.83% |
| Westwood Primary | 43.58 | 45.34 | 1.76 | 4.04% |
| Subtotal | 809.58 | 832.54 | 22.96 | 2.84% |
| Rest of Province | ||||
| 2016-17 | 2017-18 | Change | % Change | |
| Alberton Elementary | 10.92 | 10.34 | -0.58 | -5.31% |
| Amherst Cove Consolidated | 11.85 | 11.1 | -0.75 | -6.33% |
| Belfast Consolidated School | 10.28 | 9.39 | -0.89 | -8.66% |
| Bloomfield Elementary | 16.82 | 16.93 | 0.11 | 0.65% |
| Bluefield High School | 39.34 | 42.35 | 3.01 | 7.65% |
| Cardigan Consolidated School | 7.61 | 7.85 | 0.24 | 3.15% |
| Central Queens Elementary | 18.72 | 18.12 | -0.6 | -3.21% |
| Donagh Regional | 10.33 | 16.89 | 6.56 | 63.50% |
| Ellerslie Elementary | 15.25 | 14.5 | -0.75 | -4.92% |
| Englewood School | 15.42 | 14.9 | -0.52 | -3.37% |
| Georgetown Consolidated | 6.28 | 5.63 | -0.65 | -10.35% |
| Gulf Shore Consolidated | 20.9 | 20.53 | -0.37 | -1.77% |
| Hernewood Intermediate | 19.06 | 18.35 | -0.71 | -3.73% |
| Kensington Int High School | 23.67 | 22.83 | -0.84 | -3.55% |
| Kinkora Regional High School | 12.74 | 12.47 | -0.27 | -2.12% |
| M. E. Callaghan Intermediate | 16.95 | 15.17 | -1.78 | -10.50% |
| Miscouche Consolidated | 17.9 | 17.19 | -0.71 | -3.97% |
| Montague Consolidated | 30.5 | 34.32 | 3.82 | 12.52% |
| Montague Intermediate | 19.07 | 17.94 | -1.13 | -5.93% |
| Montague Regional High School | 32.33 | 31.02 | -1.31 | -4.05% |
| Morell Consolidated | 14.24 | 13.87 | -0.37 | -2.60% |
| Morell Regional High School | 18.36 | 16.28 | -2.08 | -11.33% |
| Mount Stewart Consolidated | 14.7 | 16.32 | 1.62 | 11.02% |
| O'Leary Elementary | 10.44 | 10.15 | -0.29 | -2.78% |
| Queen Elizabeth Elementary | 20.03 | 21.93 | 1.9 | 9.49% |
| Somerset Elementary | 12.84 | 11.82 | -1.02 | -7.94% |
| Souris K-12 | 43.2 | 42.68 | -0.52 | -1.20% |
| Southern Kings Consolidated | 14.7 | 12.86 | -1.84 | -12.52% |
| St. Louis Elementary | 12.12 | 11.51 | -0.61 | -5.03% |
| Tignish Elementary | 14.25 | 13.22 | -1.03 | -7.23% |
| Vernon River Consolidated | 14.42 | 13.34 | -1.08 | -7.49% |
| Westisle Composite High School | 37.07 | 35.86 | -1.21 | -3.26% |
| Subtotal | 582.31 | 577.66 | -4.65 | -0.80% |
| Total | 1391.89 | 1410.2 | 18.31 | 2.04% |
Some teacher positions, not connected to schools, have not been included on this table.
Preliminarynews of teacher allocations in some schoolshadalready garneredcomplaints, prior to the final numbers being released.
The Public Schools Branch re-allocates teacher positions every year, to accommodate changes in school populations, but extra attention has been paid to the process this year.
From September through April the Public Schools Branch conducted a review ofschools, with an eye to rezoning and possibly closing some schools. Three schools were recommended for closure, but the provincial government decided against closing any.
Big moves
Many of the schools have large populationchanges, because while no schools were closed, there was extensive rezoning of students.
The process put parents on their guard, particularly in rural areas, and they have been expressing concern about teaching positions being moved out of their schools.
The total number of positions outside of the four largest communities is down slightly, 4.65positions or 0.8per cent.
In the largest communities the number of positions is up by 22.96positions, or 2.84per cent.
Of the 56 schools in the province, there were 11 that saw changes of more than 10 per cent.
- Birchwood Intermediate School: +73.82%
- Donagh Regional: +63.5%
- Georgetown Consolidated: -10.35%
- M. E. Callaghan Intermediate: -10.5%
- Montague Consolidated: +12.52%
- Morell Regional High School: -11.33%
- Mount Stewart Consolidated: +11.02%
- Southern Kings Consolidated: -12.52%
- Stonepark Intermediate: -20.89%
- Stratford Elementary: +14.9%
- West Kent Elementary: +78.01
- MORE P.E.I. NEWS |Stroke patient Tim Bolger advocates for the help he needs to recover
- MORE P.E.I. NEWS |Neighbour of P.E.I.'s abandoned bridge fabrication yard wants it cleaned up
Corrections
- A previous version of this story put Westwood Primary and L.M. Montgomery in the wrong category. They are now listed as part of the four larger communities. Graph numbers have been adjusted.Jun 07, 2017 5:29 PM AT




_(720p).jpg)

 OFFICIAL HD MUSIC VIDEO.jpg)
.jpg)


