Crystal meth use causes spike in Regina property crime, say police
Property crime in Regina is up almost 18 per cent, police blame increased availability of meth

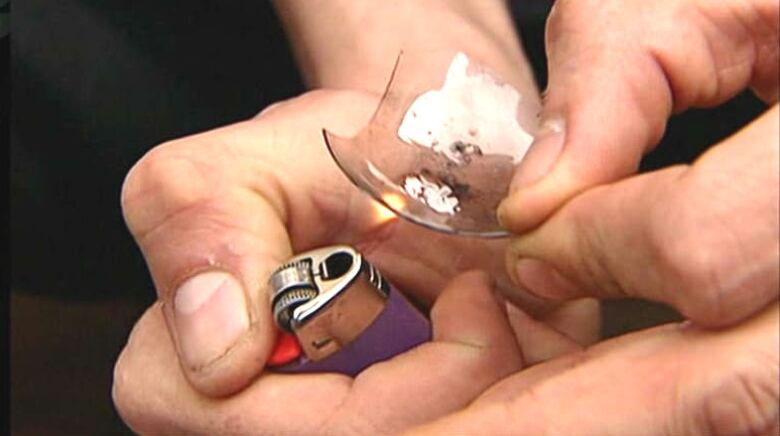
Regina's deputy police chief Dean Rae says an increase in crystal methusein the city has caused a spike in crime.
According to Regina's mid-year crime report released Wednesday, property crime is up almost 18 per cent compared to where it was at this time last year.
There havebeen more arsons, break and enters and car thefts so far in 2016.
"It's our belief that a lot of the people on crystal meth are involved in property crimes to support their habits," saidRae.
"We've seen an increase in the number of stolen autos as well as an increase in the number of theft from autos [and] break and enters."
Rae saidthe affordability of the drug, as well as the fact that it is highly addictive, is why police are seeing more of it in Regina.
"When it first came to the city it was very localized and only a few people were using it. And now that has increased to a larger group. And that usually indicates that there's increased availability," he said.
Rae saidpolicing and enforcement is only one of the ways to battle a rise in methabuse. He saidpartners like the drug treatment court as well as more drug education in the city will hopefully curb meth use.
One of the positive takeaways from the crime stats is that crimes against people, like homicides and assaults, have dropped. They are down about 2 per cent from mid-year 2015.
There has been a big jump in attempted murder, however, with14 reported so far this year, compared to only three at this time last year.
Total crime is at its highest point since 2012 in Regina. However, compared to mid-2007, the city has had 20 per cent less crime reported so far this year.
Here is a breakdown of some of the crimes highlighted in the 2016 mid-year report compared to the 2015 mid-year report (from Jan. 1 to June 30):
Total crime
- 2016: 8,674
- 2015: 8,411
- Increase: 263
- Average per year since 2010: 8,962
Crimes Against the Person
- 2016: 1,209
- 2015: 1,232
- Decrease: 23
- Average per year since 2010: 1,358
Homicide
- 2016: 4
- 2015: 5
- Decrease: 1
- Average per year since 2010: 4
Attempted Murder
- 2016: 14
- 2015: 3
- Increase: 11
- Average per year since 2010: 5
Assault
- 2016: 871
- 2015: 899
- Decrease: 28
- Average per year since 2010: 965
Sexual Assaults
- 2016: 61
- 2015: 64
- Decrease: 3
- Average per year since 2010: 62
Robbery
- 2016: 110
- 2015: 113
- Decrease: 3
- Average per year since 2010: 132
Kidnapping/Forcible Confinement
- 2016: 2
- 2015: 2
- No change
- Average per year since 2010: 5
Criminal Harassment/Stalking
- 2016: 13
- 2015: 13
- No change
- Average per year since 2010: 14
Crimes Against Property
- 2016: 5,501
- 2015: 4,675
- Increase: 826
- Average per year since 2010: 5,146
Theft of Motor Vehicle
- 2016: 543
- 2015: 362
- Increase: 181
- Average per year since 2010: 450
Theft
- 2016: 2,361
- 2015: 2,072
- Increase: 289
- Average per year since 2010: 2,300
Break and Enters
- 2016: 728
- 2015: 665
- Increase: 63
- Average per year since 2010: 663
Mischief/Willful Damage
- 2016: 1,164
- 2015: 1,082
- Increase: 82
- Average per year since 2010: 1,232
Arson
- 2016: 89
- 2015: 50
- Increase: 39
- Average per year since 2010: 39
Prostitution
- 2016: 1
- 2015: 11
- Decrease: 10
- Average per year since 2010: 36
Controlled Drugs andSubstances Act
- 2016: 263
- 2015: 264
- Decrease: 1
- Average per year since 2010: 280
Traffic Tickets Issued
- 2016: 13,205
- 2015: 12,580
- Increase: 625
- Average per year since 2010: 14,913
Calls for Service
- 2016: 29,223
- 2015: 29,878
- Decrease: 655
- Average per year since 2010: 29,738


_(720p).jpg)


 OFFICIAL HD MUSIC VIDEO.jpg)
.jpg)


